

Plotting Chandelier, BBStops™, and Parabolic stops on the price chart is a feature available to BollingerBands.us subscribers. The stops and systems can be plotted for long and short positions. As data is updated your stops are updated automatically.
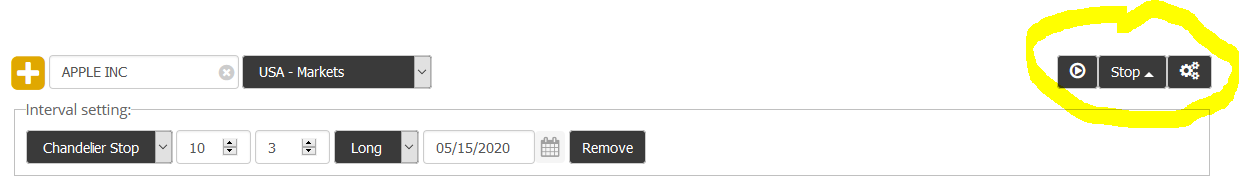
Stops can be activated at the top right above the chart.
Chandelier Stops
Chandelier Stops were popularized by Chuck LeBeau. They are dynamic, progressive stops that are calculated starting with the period after you enter a trade. The formulas are simple and robust. For sell stops when you are long the stop is the highest high since you entered the trade less n times the m-day Average True Range (ATR). For buy stops when you are short the stop is the lowest low since you entered the trade plus n times the m-day ATR. The usual defaults are n = 3 and m = 10, so a “normal” Chandelier sell stop is the highest high since entry less three times the 10-period ATR.
True Range (TR) is a measure of range that incorporates any gaps that may occur in the price structure between periods. For the true high, the value is the current period's high or prior period's close, whichever is higher. For the true low, the value is the current period's low or prior period's close, whichever is lower. TR is the true high minus the true low. ATR is an n-period average of TR, where n is usually 10.
Chandelier Stops may change each period an open position is held as ATR will change even if a new high (when long) or low (when short) since entry isn't recorded. One question that often comes up is whether to allow the stop to back off? For example, if this period's stop for a short position is 33.35 and next period's is 33.5 due to an expansion in ATR, should we stick with the more conservative stop of 33.35 or allow it to back off a bit to 33.5? Chuck LeBeau's answer is that backing off is a feature of Chandelier Stops that should be allowed and that is good enough for us.
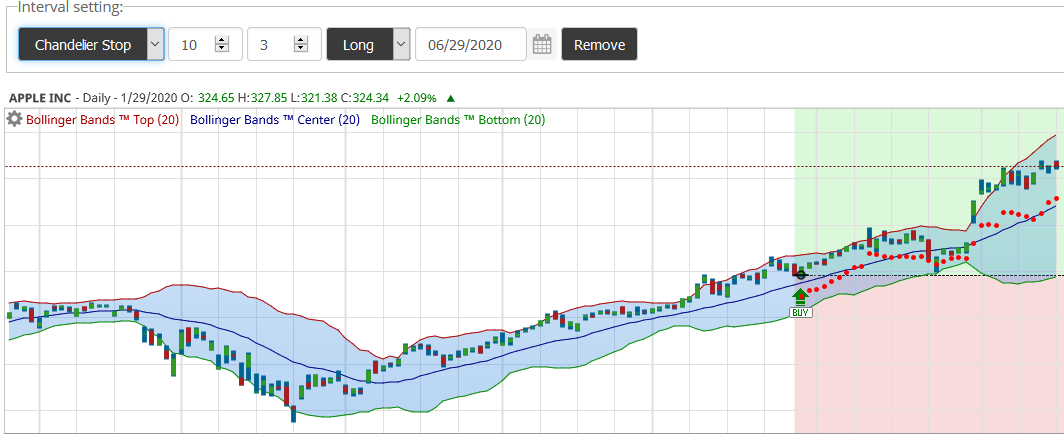
To plot a Chandelier Stop, Specify the lookback period and the ATR multiplier (the default is 10 and 3), select long or short, and specify the entry date.
- For a long trade: A green arrow is drawn at the entry and a red arrow is drawn at the exit if the position is closed.
- For a short trade: A red arrow is drawn at the entry and a green arrow is drawn at the exit if the position is closed.
Parabolic Stops
These stops are derived from a price and time trading system, SAR (stop and reverse), introduced by Welles Wilder in his 1978 book “New Concepts in Technical Trading Systems”. The Parabolic stop trails the price as the trend extends over time. In an uptrend the stop rises from below the price line and in a downtrend the stop falls from above the price line. When the price trend breaks below or above the indicator line the stop is triggered.
The algorithm used for calculating the SAR:
- In an uptrend:(Long Trade)
- Current SAR = Prior SAR + Prior AF × (Prior EP − Prior SAR)
- Where EP (Extreme Point) is the highest high in the current trend
- AF (Acceleration Factor) which starts at the user-specified step value (default is 0.02) and increases by the step value each time a new high is made in the current trend. The AF stops increasing at the user-specified limit (default is 0.2).
- In a downtrend:(Short Trade)
- Current SAR = Prior SAR − Prior AF × (Prior SAR − Prior EP)
- Where EP (Extreme Point) is the lowest low in the current trend
- AF (Acceleration Factor) which starts at the user-specified step value (default is 0.02) and increases by the step value each time a new low is made in the current trend. The AF stops increasing at the user-specified limit (default is 0.2).
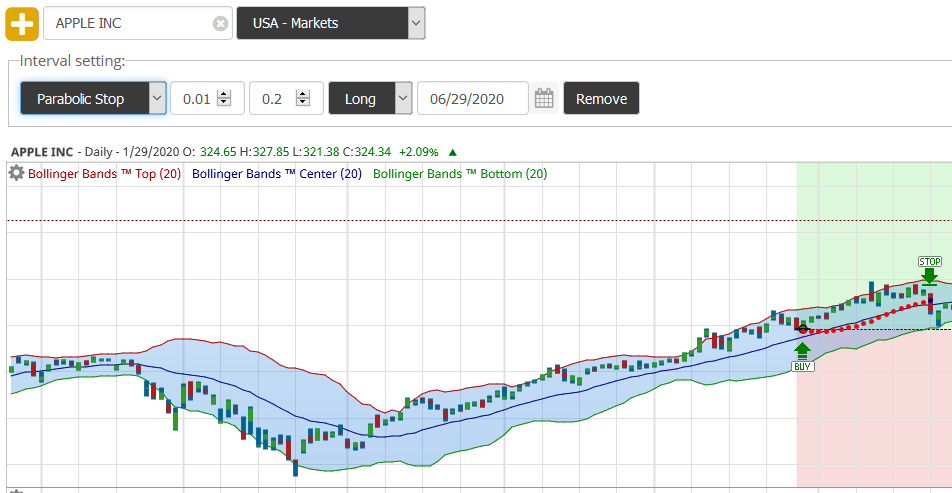
To plot the Parabolic stops, use the pull-down menu to specify the AF step (default 0.01) and the maximum AF (default 0.2) parameters, a long or short position, and the entry date.
After you plot the chart, the Parabolic Stops will be plotted starting from the entry position to the end of the chart. The stop will reverse when each position is closed and a new trade is initialized.
- For a long trade: A green arrow is drawn at the entry and a red arrow is drawn at the exit if the position is closed.
- For a short trade: A red arrow is drawn at the entry and a green arrow is drawn at the exit if the position is closed.
BBStops™
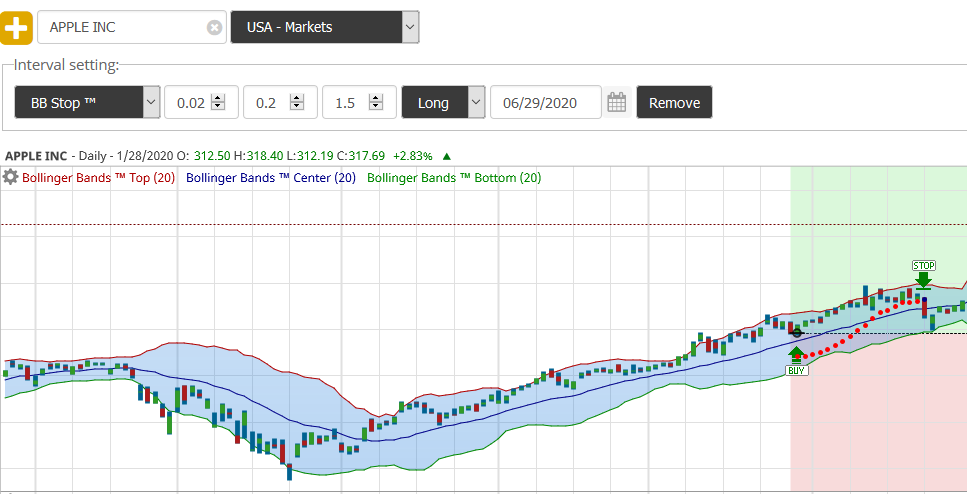
BBStops are a variation on Parabolic stops where the initial stop point is offset below the low of the entry period for long trades, or above the the high of the entry period for short trades by the calculation mechanism used in Bollinger Envelopes™. This combination of the Parabolic stop mechanism and the Bollinger Envelope interval proves to be a powerful one that requires that the trade perform in addition to tracking the trade's progress. See Help for Parabolic stops above for more details. BBStops are only plotted for a single position. The default for the BE parameter is 1.5, which we find to work well, but you can try smaller values for more conservative stops or larger values to give the trade more room to “breath”.
To plot a BBStop, use the pull down menu to select the AF step (default 0.02), the maximum AF (default 0.2) parameters, and BE offset (default 1.5) parameters, long or short, specify the entry date.
 U.S.A.
  Italy
ItalyTrading idea
Click on chart to read John Bollinger’s commentary
Market Timing
DVD
BB DVD 2013 Seminar

Bollinger on Bollinger Bands 2013: The 30th Anniversary Seminar
Introduction to Bollinger Bands
Learn how to use Bollinger Bands