

You can customize your charts with Bollinger Bands and over 50 indicators, TrendLines and systems/stops. If you are not sure what an indicator does, just click on the ? for a quick explanation.
New Users
Subscribe now and start your free trial for full access to all the advanced chart features including more than 50 indicators, trading signals, powerful screening and daily lists of trading ideas!
- Search
- Stop
- Config

Control the number of days shown in the chart by clicking on the + - or expand/contract the data by dragging the highlighted area.
To add additional indicators to the chart select from the Oscillator list.
In addition to the traditional chart types such as Western bars or Japanese candlesticks we offer Bollinger Bars, our exclusive marriage of western bars and candlesticks encoded in color:
- The area between the opening price and the closing price is known as the body
- When the close is higher than the open the body is green.
- When the close is lower than the open the body is red.
- The blue sections of the bar fill out the remainder of the range, from the top of the body to the high and the bottom of the body to the low
In addition, the signals for the Bollinger Bands Methods are indicated on the charts:
For PRO users only: Arrows plotted on the charts indicate a signal for John Bollinger's four Methods. The arrow is green or red, up/down, to depict the bullish or bearish trend.
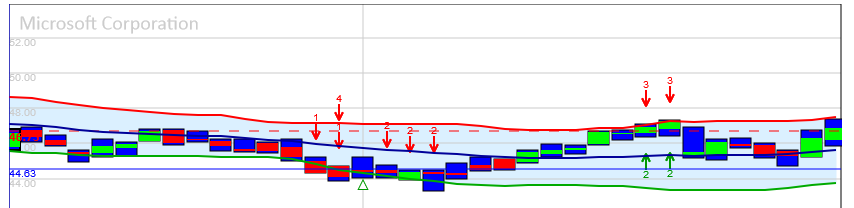
The number near the arrow indicates the system number generating the signal, per the following legend:
- 1 = Volatilty Breakout
- 2 = Trend Following
- 3 = Reversals
- 4 = Confirmed Breakout