

Screening: Here you can create your own lists to explore a wide variety of criteria, starting with Bollinger Bands, %b, and BandWidth, and covering volume, a wide selection of technical indicators and signals. Once you have refined your Screen, you can save it for future use. You can also export the screened list as a cvs file for further review. Below is a detailed explanation of the filters available.
Volume
Average volume = 50 day simple moving average of volume
Normalized volume = last trading volume divided by the 50-day average volume.
Example:
2x average volume means that the last trading volume was two times greater than the average trading volume.
W-bottom
W bottoms are technical analysis bottom formations that consist of a pair of lows separated by an intervening peak creating a W pattern. Our screening requires that the first low be outside of the lower band and the second low be inside the band. In addition we utilize a number of other filter criteria to eliminate all but the best candidate formations. It is important to understand that these are candidate formations that require confirmation before action is taken.
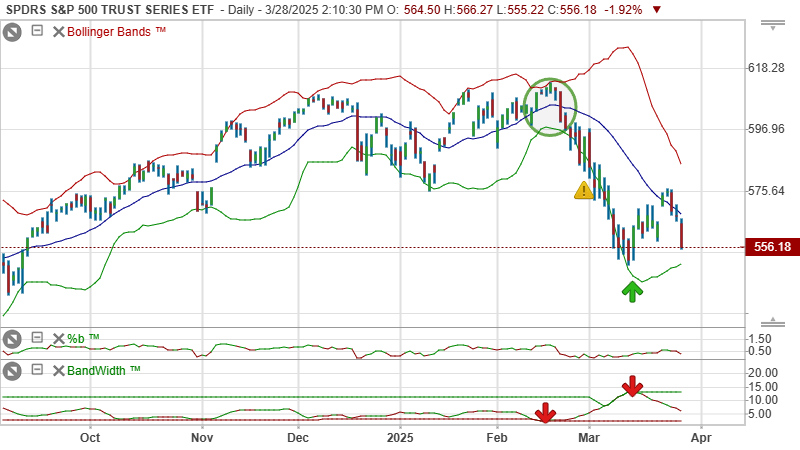
%b (Percent b)
%b >= 1: Close above the upper Bollinger Band.
%b <= 0: Close below the lower Bollinger Band.
Back into bands(1): Closed outside the upper band yesterday, closed inside today.
Back into bands(0): Closed outside the lower band yesterday, closed inside today.
BandWidth
BandWidth measures the width of the Bollinger Bands. It is the upper Bollinger Band minus the lower Bollinger Band divided by the middle Bollinger Band.
Squeeze means a stock's BandWidth is at its narrowest (lowest %) in 6 months. Bulge means a stock's BandWidth is at its widest (highest %) in 6 months.
BandWidth of 5% and 10% are examples of tightened BandWidth, but do not necessarily constitute a Squeeze.
Bollinger Envelope Squeeze
Bollinger Envelopes are a variation on Bollinger Bands that focus on the extremes of price action. While Bollinger Bands are centered on a moving average, usually of closing prices, Bollinger Envelopes are anchored by the extremes: the highs and the lows.
The upper Bollinger Envelope is constructed from a moving average of the highs and the standard deviation of the highs; the lower Bollinger Envelope is constructed from a moving average of the lows and the standard deviation of the lows. The formulas are:
UpperBE = Average(high, 20) + 1.5 × StandardDeviation(high, 20)
LowerBE = Average(low, 20) - 1.5 × StandardDeviation(low, 20)
Since there is no middle band in the calculation, we must imply one by taking the mean of the upper and lower envelopes.
MiddleBE = (UpperBE + LowerBE) ÷ 2
Bollinger Envelopes are particularly useful in periods of extreme market action. They are also important in markets where the trading session is not well defined, and are used in the Ice Breaker trading system.
Powershifts and Pivots
 A positive PowerShift signal occurs when a security has become severely oversold and strengthens enough to potentially break the decline. Positive PowerShift signals are marked by a rising wedge with a green core plotted beneath the day on which they occurred.
 A negative PowerShift signal is just the opposite of a positive PowerShift with a small variation in the logic and is marked by a falling wedge with a red core plotted above the day on which it occurred.
 A negative Pivot occurs when a severely oversold security strengthens and then fails. A pivot sell is marked by a red minus sign plotted above the day it occurs.
 A positive Pivot is the reverse of a negative Pivot, again with a small change in the logic, and is marked with a green plus beneath the day on which it occurred.
There is a difference in the logic between the positive and negative signals, based upon the idea that declines generally precede at a faster pace than advances. (The old saw goes, "Down is faster!")
Pivots usually, but not necessarily, occur after PowerShifts. Conceptually Pivots are companions to PowerShifts and should mark reaction highs after important lows and vice versa. An idealized chart is presented below.
For daily charts, a PowerShift or Pivot may appear on the current day, however the signal is not confirmed until the close.
Weekly signals are calculated at end-of-week. Any weekly signal appearing for the current week is not yet a confirmed PowerShift or Pivot.
Moving averages
Compare stock’s last closing price with 10-day, 20-day, 50-day, 200-day simple moving averages.
Above : closing price is greater than the moving average.
Below : closing price is less than the moving average.
DFA (Deviation from Average): set percentage of price in relation to moving average
DFA examples:
0 = price equals mov avg
10 = price is 10% above moving avg
-10 = price is 10% below moving avg
Money Flow Index (MFI)
Money Flow Index (MFI) is a volume-weighted version of Welles Wilder's RSI. We use a 10-day oscillator.
MFI is our tool of choice for identifying confirmations and nonconfirmations of tags of the Bollinger Bands.
The normal overbought level is 80 and the normal oversold level is 20.
Relative Strength Index (RSI) 9-day
Welles Wilder's 9-day Relative Strength Index. Overbought above 70 and oversold below 30.
Accumulation Distribution
This is Larry William's volume indicator derived from the relationship of the open and close to the day's range. We use a 20-day oscillator.
Intraday Intensity
This indicator is derived from David Bostian's volume indicator based on the relationship of the close to the day's range. We use a 21-day oscillator.
Look for confirmation/nonconfirmation with %b.
Volume weighted MACD
This is a volume-weighted version of Gerald Appel's MACD with 12 and 26 days used to calculate the indicator and 9 days for the signal line.
Signals are given when the indicator crosses its signal line.
Pay special attention to sells from above 0 and buys from below 0.
Momentum
Percentage change of closing price on 12 days. Momentum indicator is useful for confirming changes in trend.
You can screen for positive and negative Momentum as well as whether Momentum is increasing or decreasing on a 1 or 5-day basis.
 U.S.A.
  Italy
ItalyTrading idea
Click on chart to read John Bollinger’s commentary
Market Timing
DVD
BB DVD 2013 Seminar

Bollinger on Bollinger Bands 2013: The 30th Anniversary Seminar
Introduction to Bollinger Bands
Learn how to use Bollinger Bands