

These four Methods of using Bollinger Bands illustrate four different approaches to the market. The first three were introduced in John Bollinger's book, Bollinger on Bollinger Bands. Method IV, not mentioned in the book, is a variation of Method I. Detailed explanations for each Method are available on the METHODS section of the main menu.
Volatility Breakout (Method I)
Method I - Volatility Breakout - also known as The Squeeze, anticipates high volatility, taking advantage of the cyclical nature of volatility. Low volatility begets high volatility, so we provide lists of stocks with extremely low volatility anticipating that an expansion of volatility may follow.
Perhaps the most elegant direct application of Bollinger Bands is a volatility breakout system. These systems have been around a long time and exist in many varieties and forms. The earliest breakout systems used simple averages of the highs and lows, often shifted up or down a bit. As time went on average true range was frequently a factor.
Trend Following (Method II)
Method II - Trend Following - relies upon the idea that strong price action accompanied by strong indicator action is a good thing. It is a confirmation approach that waits for these two conditions to be met before giving an entry signal. Of course, the opposite, weakness confirmed by weak indicators, generates a sell signal. In essence, this is a variation on Method I, with an indicator, MFI, being used for confirmation and no requirement for a Squeeze. This method may anticipate some Method I signals.
Reversal (Method III)
Method III - Reversals - anticipates the reversals by comparing the contacts with the bands (tags) and Accumulation Distribution.
What we are doing with Method III is clarifying tops and bottoms by involving an independent variable, volume, via the use of volume indicators to help get a better picture of the shifting nature of supply and demand.
Confirmed Breakouts (Method IV)
Method IV, like Method I, is based on volatility breakout.
Method IV compares the actual value and the high and low of the previous bar and then takes a position at the breakout.
Every evening our Bollinger Scanner identifies stocks which may present a volatility breakout the following day. If you would like to receive email alerts, please update your preference in Service Set Up on the Home page.
 U.S.A.
  Italy
ItalyTrading idea
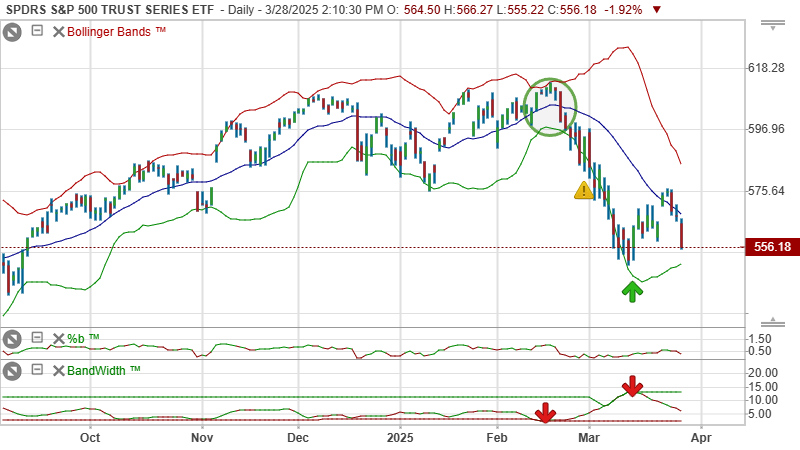
Click on chart to read John Bollinger’s commentary
Market Timing
DVD
BB DVD 2013 Seminar

Bollinger on Bollinger Bands 2013: The 30th Anniversary Seminar
Introduction to Bollinger Bands
Learn how to use Bollinger Bands